

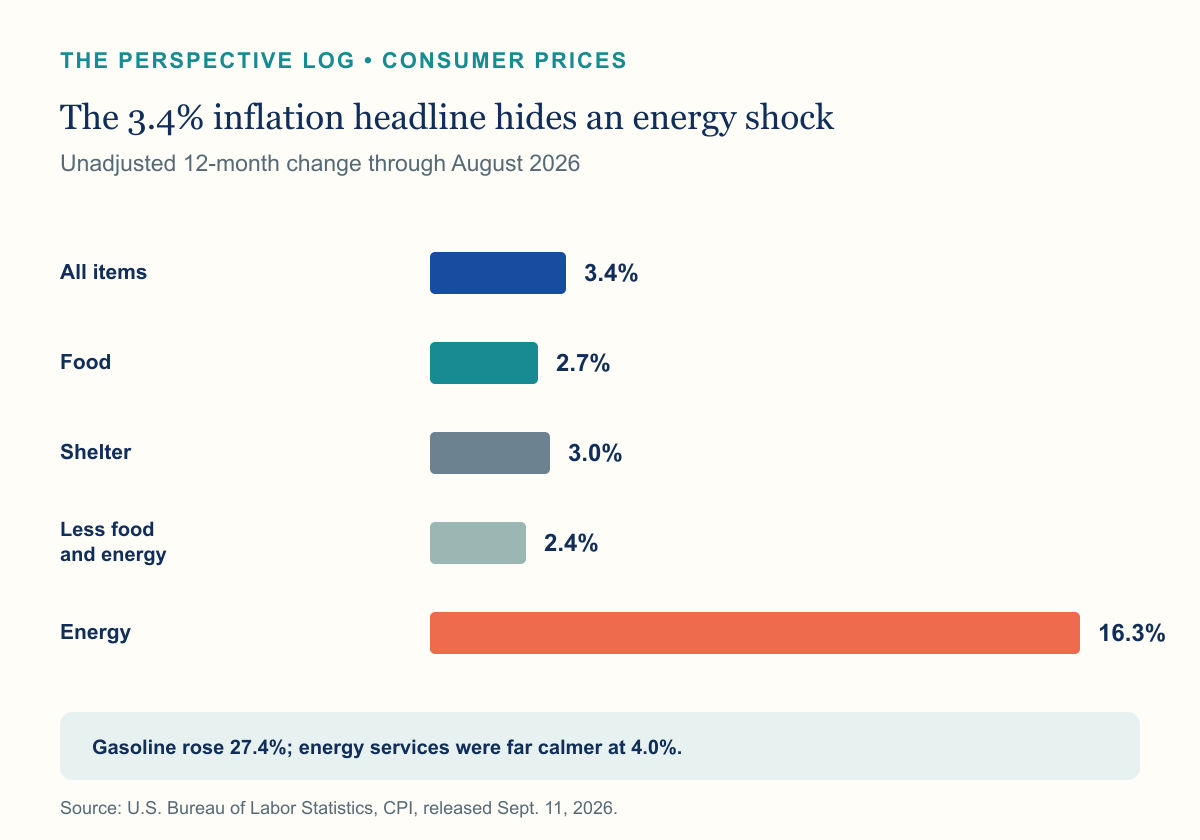
Consumer inflation held at 3.4% in August, but the average conceals a much sharper energy shock. Energy prices were 16.3% higher than a year earlier, and gasoline was up 27.4%, the Bureau of Labor Statistics reported Friday.

That split matters more than the headline for many households. A retired couple that drives often can feel substantially more pressure than one with low mileage and fixed utility costs. Another household facing a large insurance renewal may have a different experience again.
The useful response is not to declare that inflation is either “only 3.4%” or “really 16.3%.” Both figures describe the national index, at different levels. Your decision starts with the categories that dominate your own spending and the cash you will need before those costs can change again.
What changed
The Consumer Price Index for All Urban Consumers rose 0.4% in August after increasing 0.1% in July. Over 12 months, the all-items index rose 3.4%, the same annual rate reported for July.
Gasoline drove more than one-third of the monthly increase. Its seasonally adjusted price index rose 3.9% in August. The broader energy index increased 2.1% for the month and 16.3% over the year.
The detail is uneven. Energy commodities rose 28.0% over 12 months, with gasoline up 27.4% and fuel oil up 52.0%. Energy services were much calmer: electricity rose 3.8% and utility piped gas rose 4.4% over the year.
Outside energy, the picture was less severe. Food rose 2.7% over the year, shelter 3.0%, and the index excluding food and energy 2.4%. Medical care rose 1.6% over 12 months. In August alone, medical care declined 0.2% and motor vehicle insurance declined 0.8%.
Those declines do not reverse earlier price increases or guarantee cheaper bills for every household. They show why one national average can describe several very different spending experiences.
Why it matters
CPI-U is built from a weighted basket of goods and services purchased by urban consumers. The weights reflect average spending patterns for the covered population. Your household does not spend according to those exact weights.
If gasoline takes 8% of your monthly spending instead of a much smaller share in the national basket, a 27.4% annual increase hits harder. If you drive little and your electricity price is fixed, it may hit less. Geography, housing tenure, health needs and insurance renewals can widen the difference.
The index also measures price change, not affordability. A 0% monthly change would mean the measured price level stopped rising for that month; it would not return prices to an earlier level.
For people approaching or living in retirement, the timing matters. A working household may be able to absorb a temporary fuel spike through income. A retiree drawing from a portfolio may need to decide whether to cut discretionary spending, hold more near-term cash or sell assets to cover the gap.
Social Security does not immediately solve that timing problem. The annual cost-of-living adjustment uses the average CPI-W for July, August and September. August CPI-W was 3.5% above a year earlier, but September still determines the third observation, and the resulting benefit adjustment is paid on a later schedule.
The case
Run a household inflation check with dollars, not national percentages. Start with the last three months of fuel, utilities, groceries, insurance and medical outlays. Compare each category with the same period a year earlier when seasonal use matters.
Then separate recurring costs from volatile ones. Electricity, insurance and housing payments often change on schedules. Gasoline can move weekly. A useful reserve covers the actual bills due before the next predictable income or portfolio withdrawal—not a theoretical basket.
If energy spending has jumped, look first for operating changes that do not impair the plan: consolidate trips, compare fuel rewards with their fees, review utility rate options and move flexible travel. Large purchases need current quotes; the CPI is not a substitute for a dealer, contractor or insurer’s price.
For retirement withdrawals, avoid turning one energy-heavy month into a permanent spending assumption. A cash bucket or short-term bond ladder can absorb temporary variation. The longer-term allocation still needs to address inflation, growth, taxes and sequence risk together.
Investors should also resist trading the headline. August core inflation was 2.4% over the year while energy was 16.3%. Those numbers can influence rates, profits and market expectations, but they do not identify the next winning asset. A written rebalancing rule is sturdier than a one-report forecast.
The other view
Energy is volatile, and some of August’s increase could reverse. Gasoline fell 2.9% in July before rising 3.9% in August. A household that rebuilds its budget around the latest monthly move can overcorrect.
Core inflation also gives a calmer signal. The index excluding food and energy rose 0.3% in August and 2.4% over 12 months. Shelter inflation was 3.0%, while medical care inflation was 1.6%. That argues against treating the energy spike as a uniform acceleration across the economy.
But excluding energy does not make the bill disappear. Fuel is purchased frequently, and it can affect travel, delivery and operating costs. A temporary shock still matters if it arrives during a period of tight cash flow or forced portfolio withdrawals.
The balanced conclusion is simple: do not extrapolate the spike indefinitely, and do not ignore the cash-flow effect while it lasts.
What to watch next
The September CPI release is scheduled for October 14 at 8:30 a.m. ET. Watch whether gasoline and fuel oil reverse, whether shelter remains near its current annual pace and whether price pressure spreads into categories that were comparatively calm in August.
For Social Security recipients, September CPI-W completes the three-month window used in the COLA formula. Do not confuse August’s 3.5% year-over-year CPI-W rate with the eventual COLA; the calculation compares third-quarter averages and rounds the result to the nearest tenth of a percent.
At home, track renewal dates before macro releases. A known insurance premium, utility adjustment or travel schedule is more actionable than a national forecast. Mark the next three large bills and the source of cash for each.
Decision in 30 seconds
- Read 3.4% as the national all-items inflation rate, not your personal rate.
- Note the concentration: energy rose 16.3% and gasoline 27.4% over 12 months; core CPI rose 2.4%.
- Compare your fuel, utilities, food, insurance and medical spending with the same period a year ago.
- Hold enough near-term liquidity for actual bills before changing a long-term allocation.
- Do not treat August’s CPI-W rate as the final 2027 Social Security COLA.
- Recheck the picture after September CPI on October 14.
Primary sources
- Bureau of Labor Statistics: Consumer Price Index — August 2026
- Bureau of Labor Statistics Handbook of Methods: CPI concepts
- Social Security Administration: Latest COLA and calculation method
- Bureau of Labor Statistics: CPI release schedule
This article is general information, not individualized investment, financial, tax or legal advice. Economic data, prices and market conditions can change.
